Why the Behavior Atlas exists
In the late 1960s, a parent approached Ogden Lindsley, the behavioral scientist who founded Precision Teaching, and asked how best to teach a particular skill. Lindsley had a stack of charts in hand and rifled through them looking for an answer. He found one, but realized the answer should be drawing on far more than the charts he happened to be holding.
That gap has never been closed.
Anyone who teaches, treats, studies, or supports human learning faces a version of that same question: is what I am doing working, how fast is it working, and what will it take to reach the goal? Educators, researchers, clinicians, and parents all need answers. Until now, no shared resource has existed to provide them.
Data on human learning gets collected every day. How fast a learner acquires a skill, how long it took, under what conditions. That data lives on individual charts, in filing cabinets, in researcher hard drives, in banker boxes. It rarely goes further. The vast majority of behavioral learning data ever collected has never been searchable, never been compared, and never informed anyone beyond the person who collected it.
The Standard Celeration Chart displays behavior on a standardized scale that makes three measures visible across any behavior, any learner, and any setting. Level shows where a learner is at any point in time, expressed as how often the behavior occurs per minute. Celeration shows the rate of change: whether behavior is accelerating, decelerating, or holding steady, and how fast. Bounce shows how stable or variable that change was. Together, these three measures describe not just whether learning occurred, but the full shape of how it unfolded. They apply equally to academic skills, social behavior, inner behavior, communication, and daily living.
When a teacher or clinician makes a decision about how much support a learner needs, that decision should be answerable by data. A reference distribution built from real cases can show what rates of change have been observed for learners starting at similar levels, under similar conditions, with similar doses, meaning the frequency and form of practice rather than time spent. Individual chart data remains the foundation. The shared record makes it possible to situate that individual data within a broader empirical picture.
The Behavior Atlas aggregates Standard Celeration Chart records from practitioners, researchers, and teachers so that anyone working to understand or improve human learning can ask questions that have never been answerable from shared data: given this behavior, this intervention, and this dose, what rates of change have been observed, and how long did it take?
Every deposited chart contributes to that reference. Lindsley started with thousands. We are starting again.
What a Standard Celeration Chart looks like
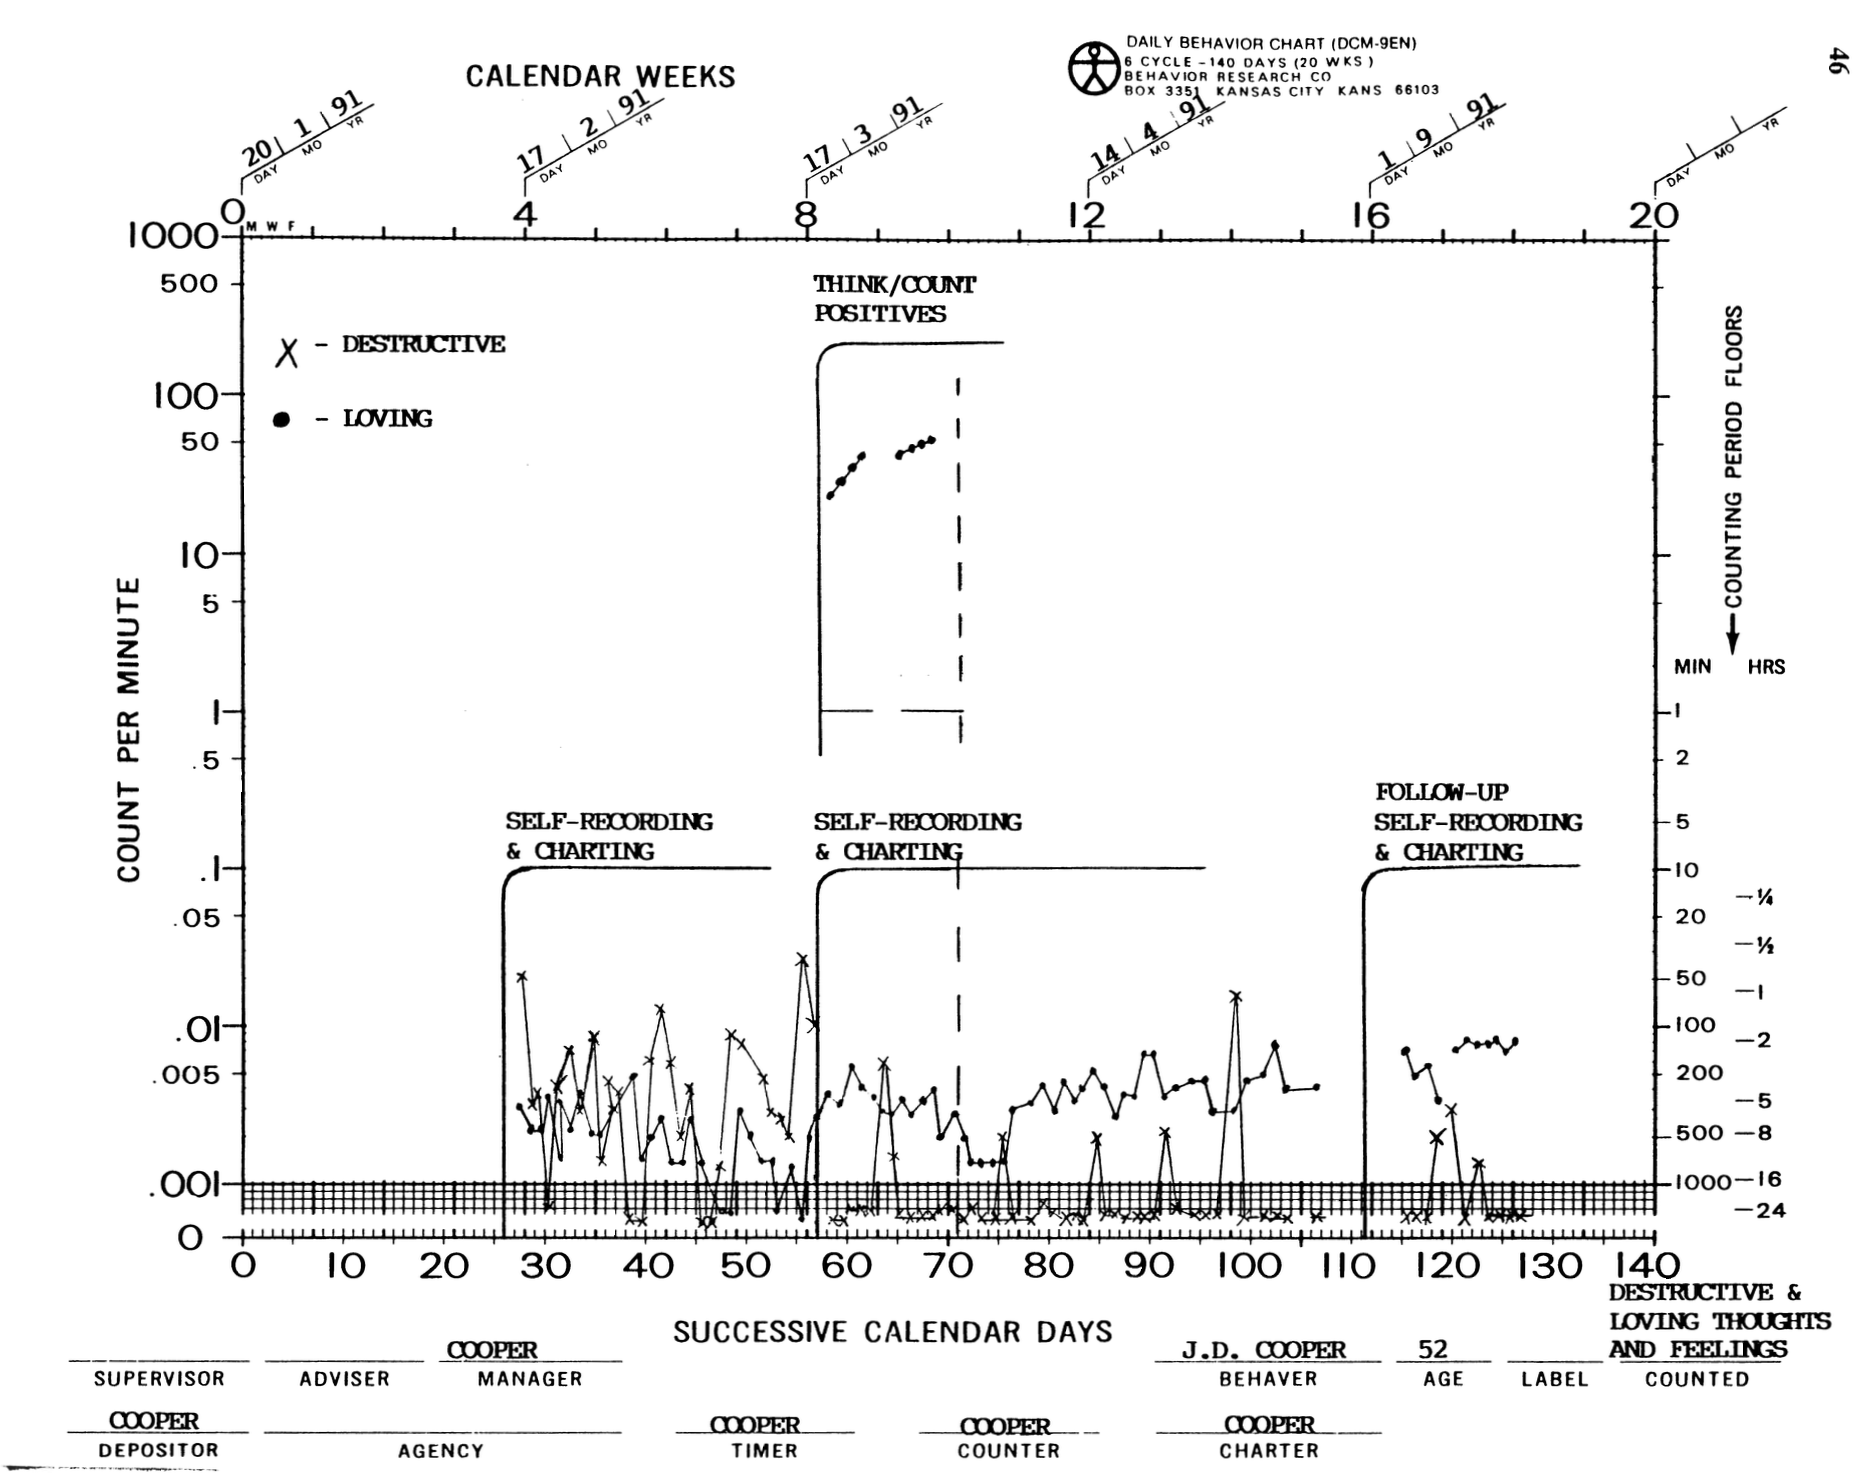
This chart shows J.D. Cooper's (1991) self-management of destructive and loving inner thoughts and feelings. Dots are loving thoughts. Crosses are destructive. A 1-minute think/count positives intervention begins at week 8. The shift is immediate and maintained at follow-up.
Level
Where responding started.
Destructive thoughts begin around 0.007 per minute in all-day counting. Loving thoughts begin lower. After the intervention they reverse.
Celeration
How fast responding changed.
During the 1-minute think/count intervention, loving thoughts accelerate sharply toward 50 per minute. After the intervention stops, the shift holds.
Bounce
How stable that change was.
The scatter of points around each phase tells you how consistent the behavior was. Tighter clusters mean lower bounce.
These three measures describe the full shape of learning — not just whether change happened, but how fast and how reliably.
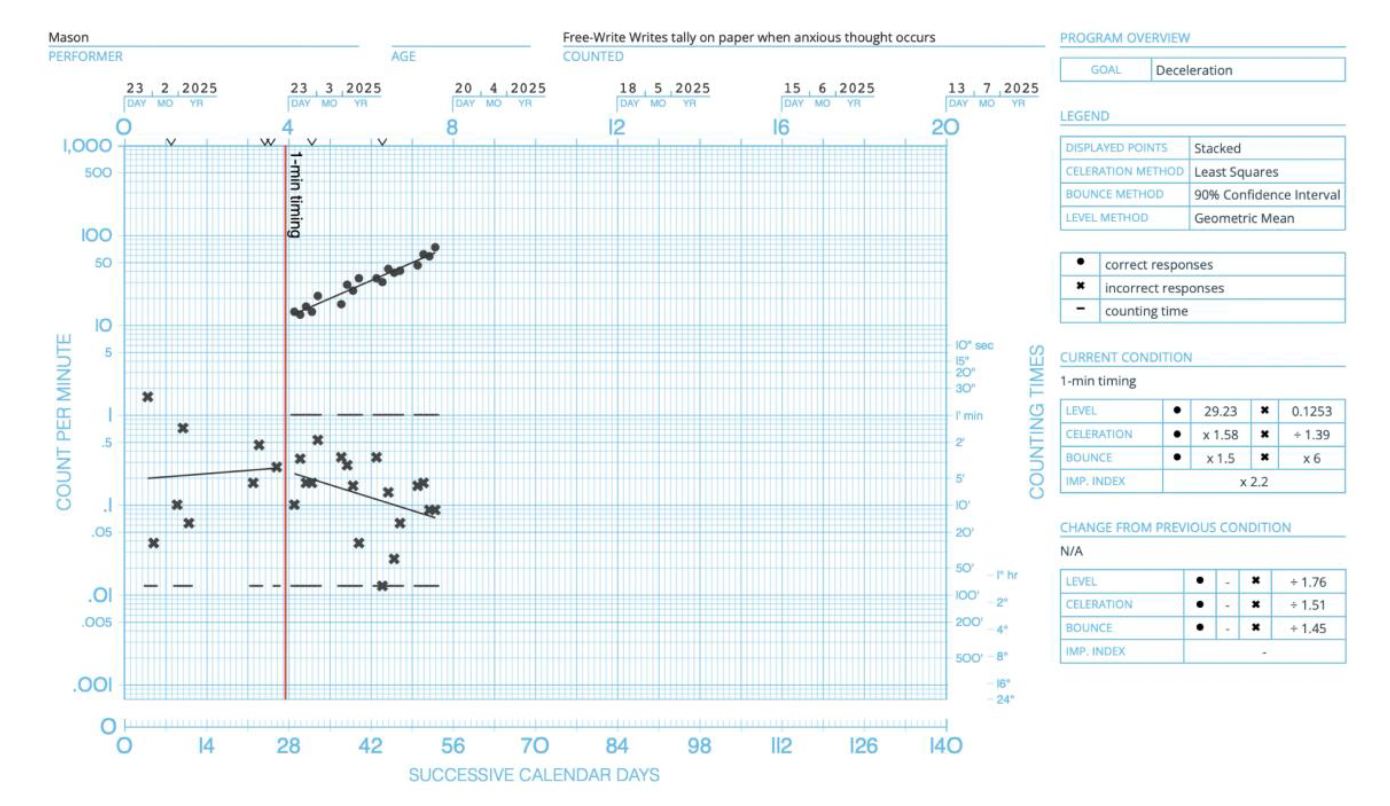
Charts look like this across settings
Why now
When the Office of Inspector General audited Applied Behavior Analysis providers across four states, every sampled provider failed the same way. They could not produce records proving therapy occurred or justifying the hours billed. The response from the field framed this as a fraud problem, a documentation problem, a billing compliance problem. It was a measurement problem.
Applied Behavior Analysis is largely billed by the hour. Hours spent, however, do not tell you whether learning occurred, how fast it occurred, or whether the amount of time prescribed was producing the change the learner needed. A provider can bill forty hours a week for a year and have no data showing whether those hours were working for that individual learner.
Precision Teaching's foundational principle is that if the learner is not progressing, the program is wrong. Not the learner. The program. That principle requires measuring whether the learner is actually progressing, which requires measuring rate of change, which requires celeration. A celeration record does not just satisfy an auditor. It answers the clinical question: is this dose working for this person, and if not, what needs to change?
The Behavior Atlas exists to make that kind of decision possible from data rather than convention. What dose has produced what rate of change, for what behavior, under what conditions? The field has collected the data to answer that question for decades. It has just never put it in one place.
Open access
All approved records are publicly readable. No paywall, no login required to browse.
Standardized deposits
A guided multi-step form captures pinpoint, dose, celeration, bounce, and aim.
Chart digitizer
Upload an SCC image, click the data points, export numeric data. No manual transcription.